Interactive Interfaces
A visual showcase of our seismic visualization platforms in action
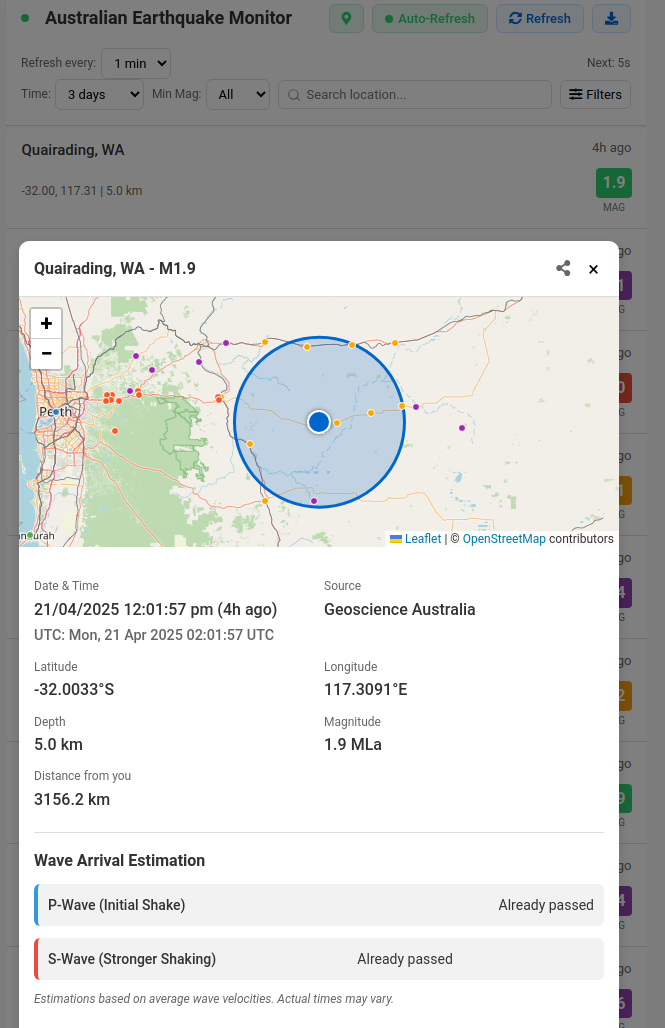
Interactive platforms for exploring earthquake data from KOERI, AFAD and Geoscience Australia, developed by a seismologist passionate about making complex data more accessible.
Explore ToolsA visual showcase of our seismic visualization platforms in action
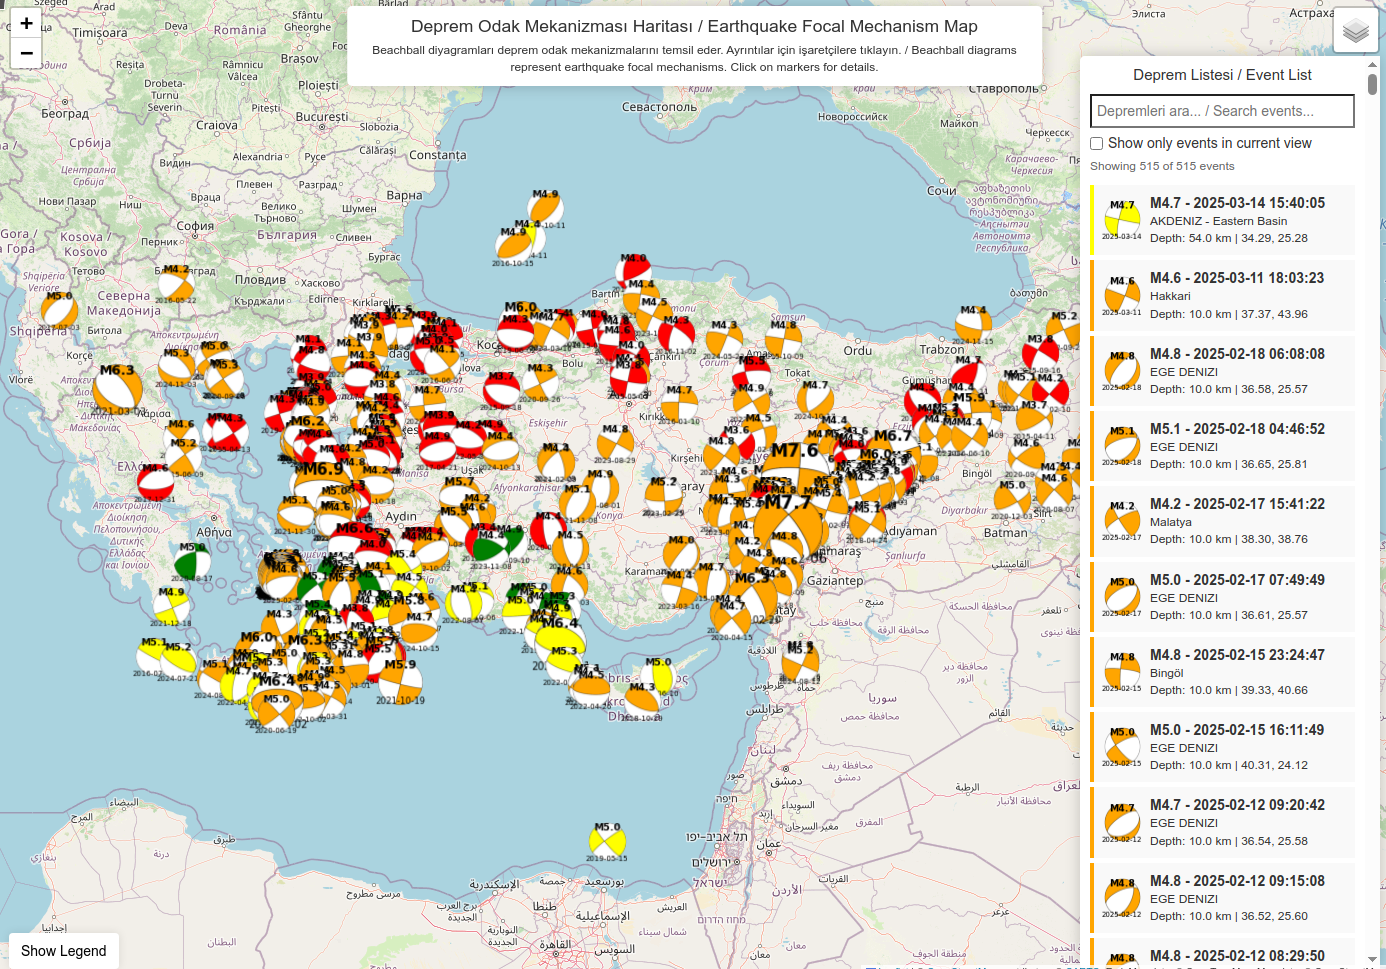
A collection of interactive tools for seismological data analysis and visualization
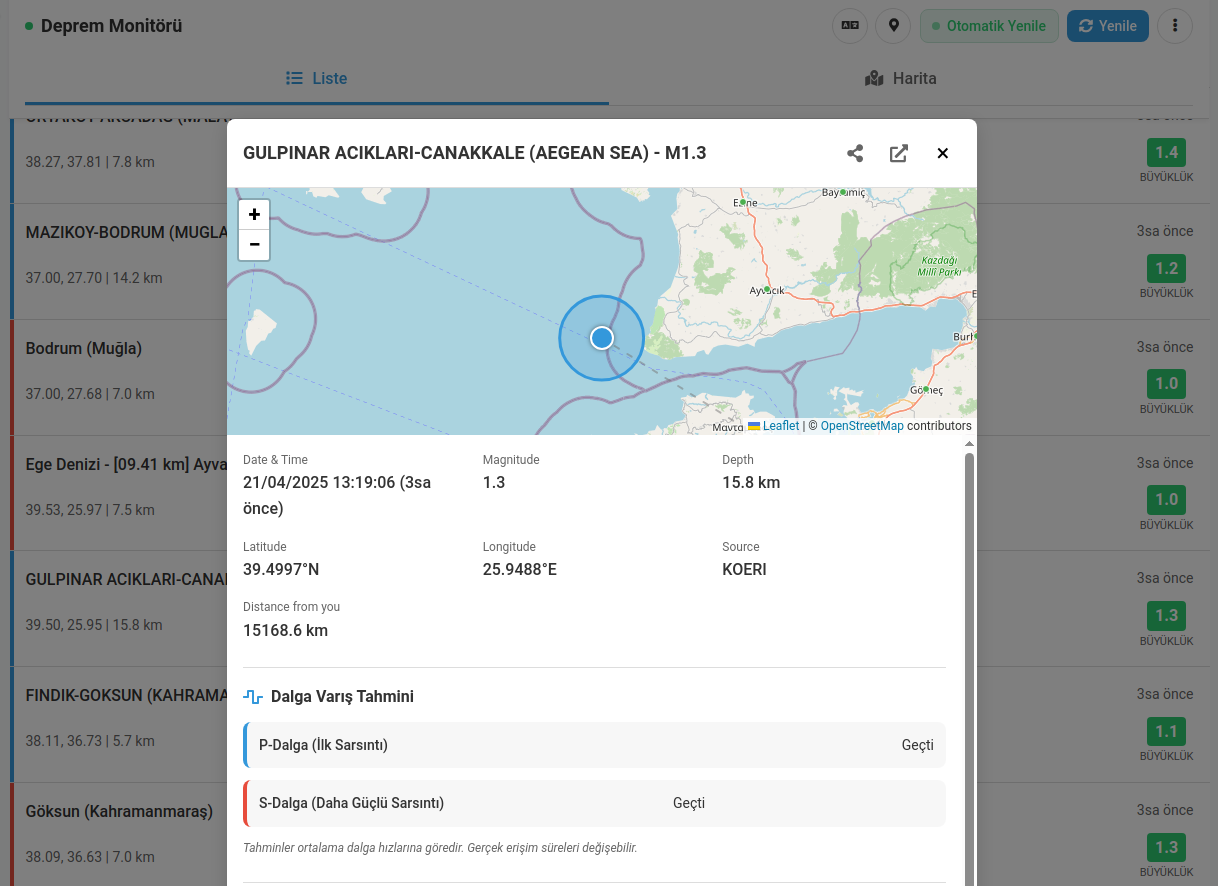
Monitor earthquake activity in real-time with mobile-friendly interfaces
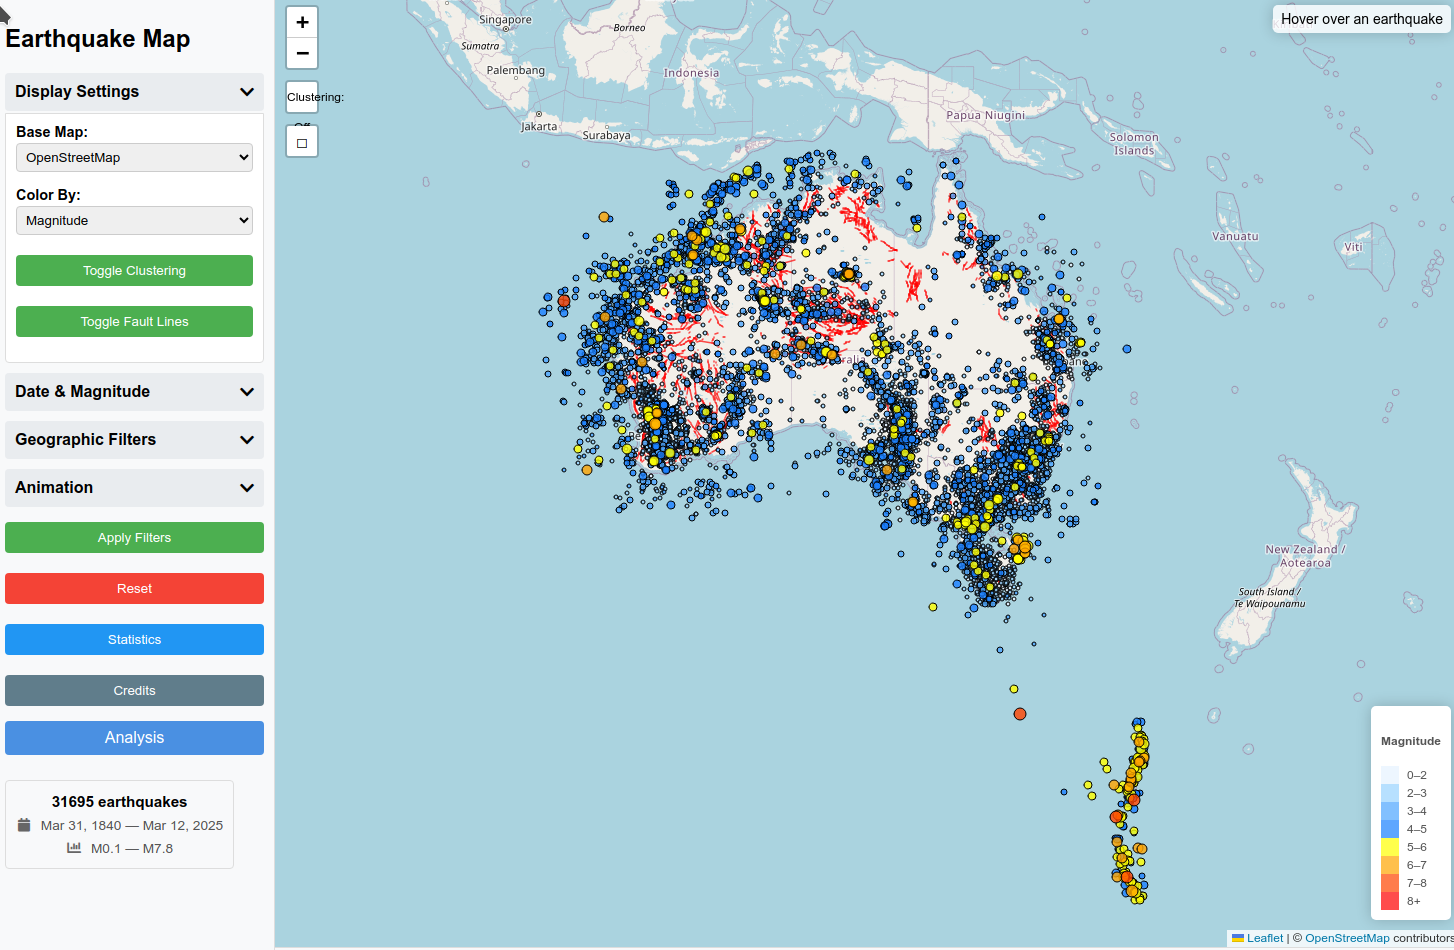
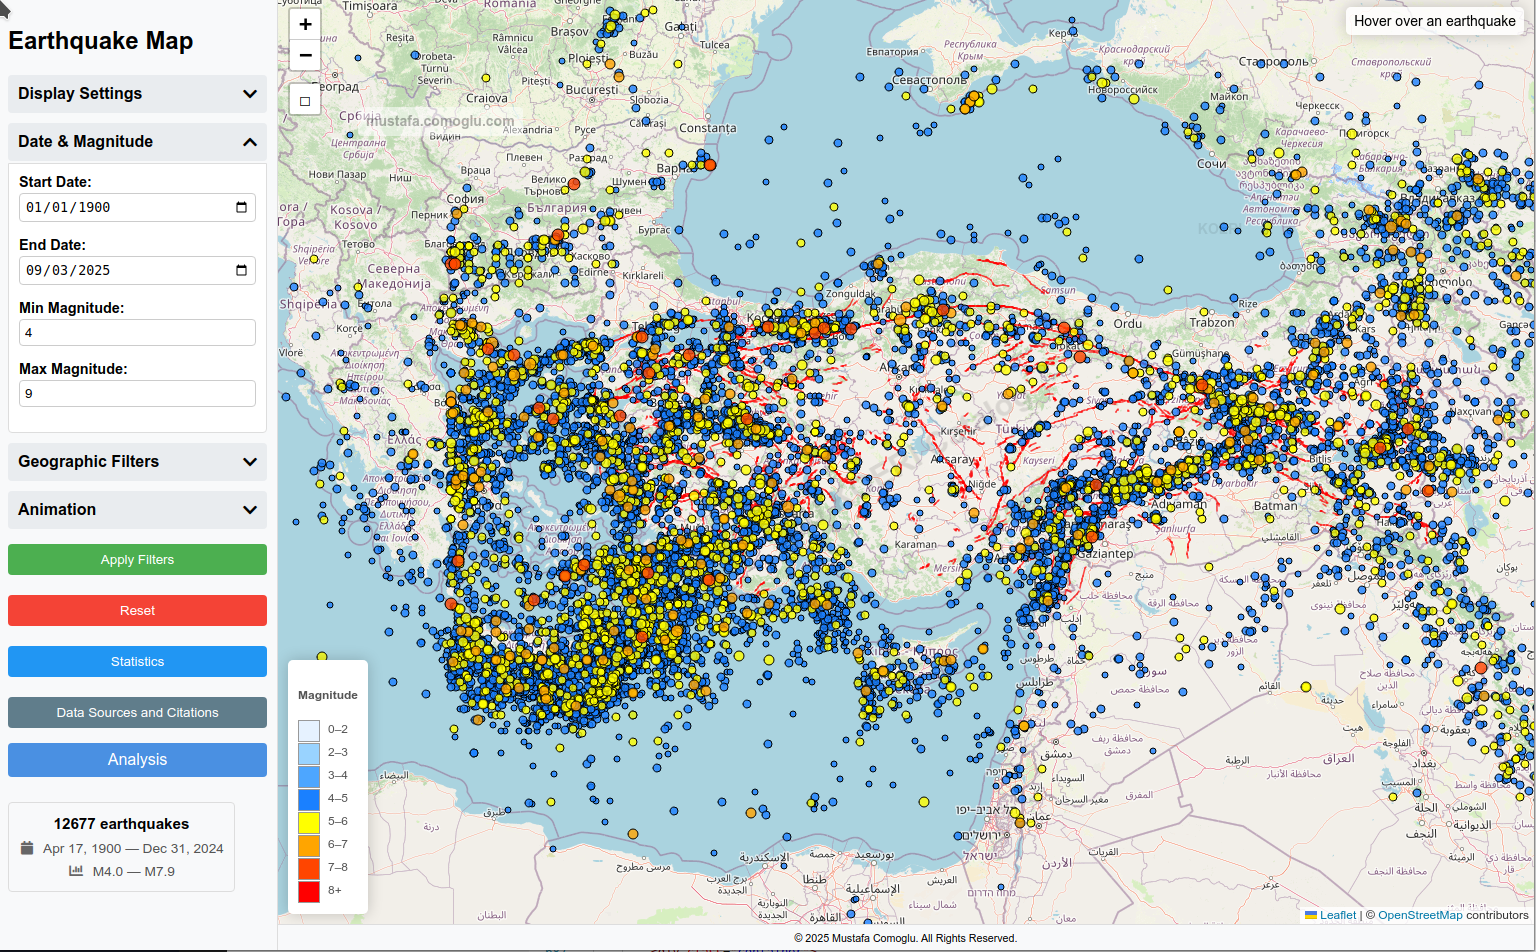
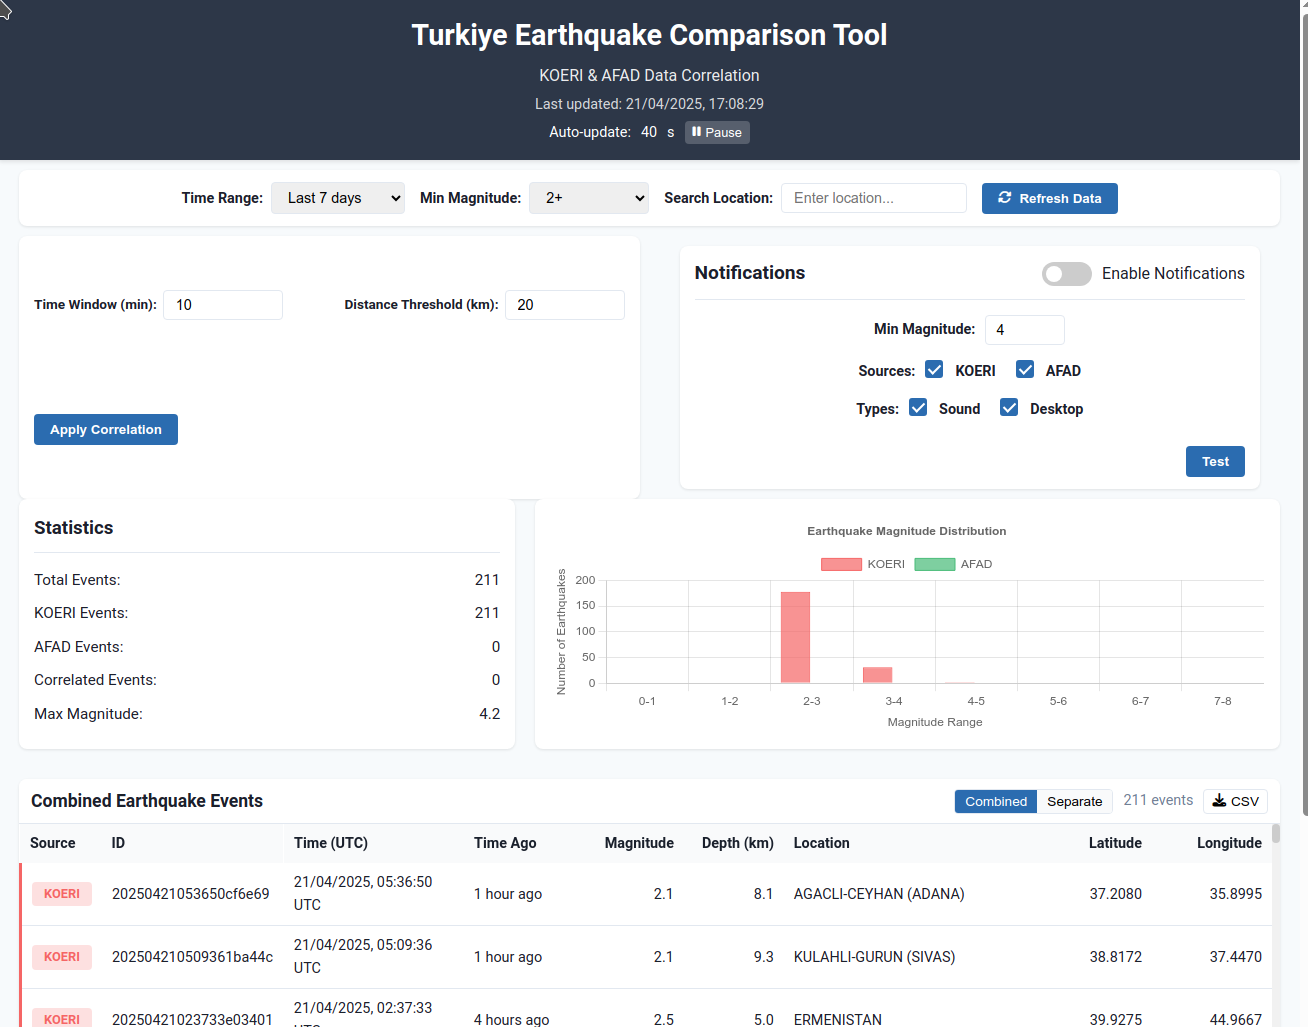
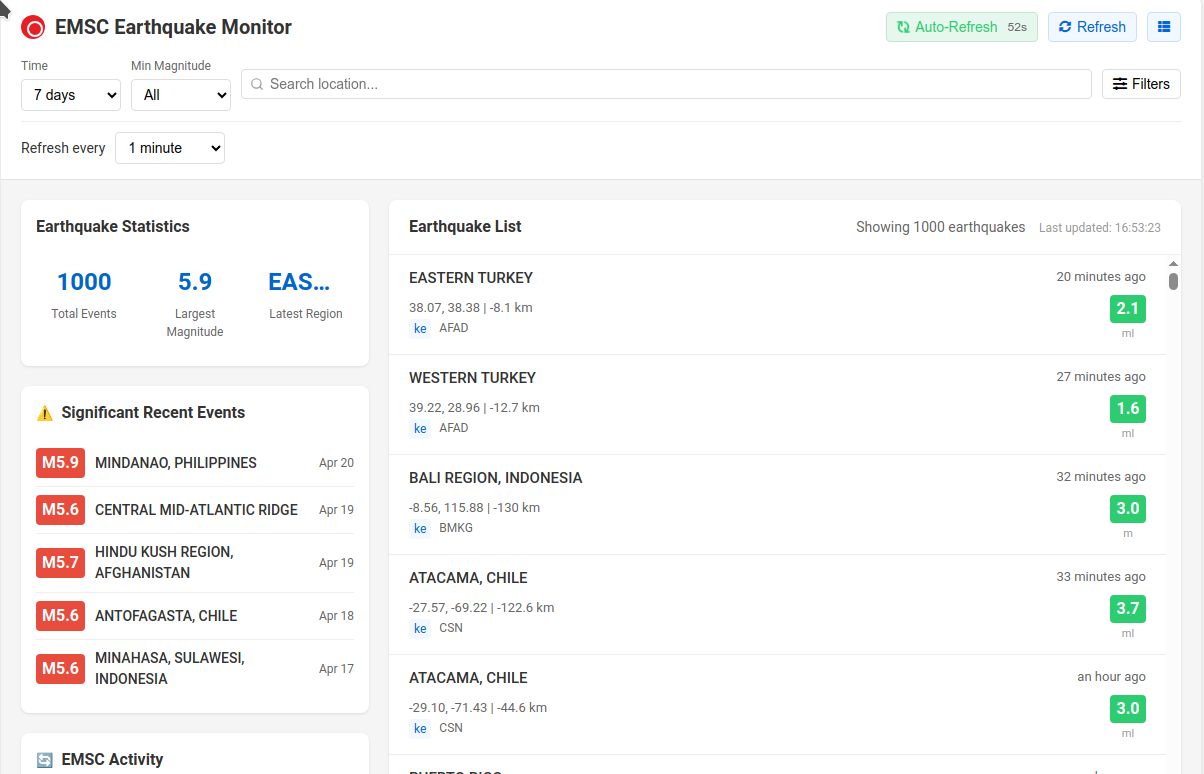
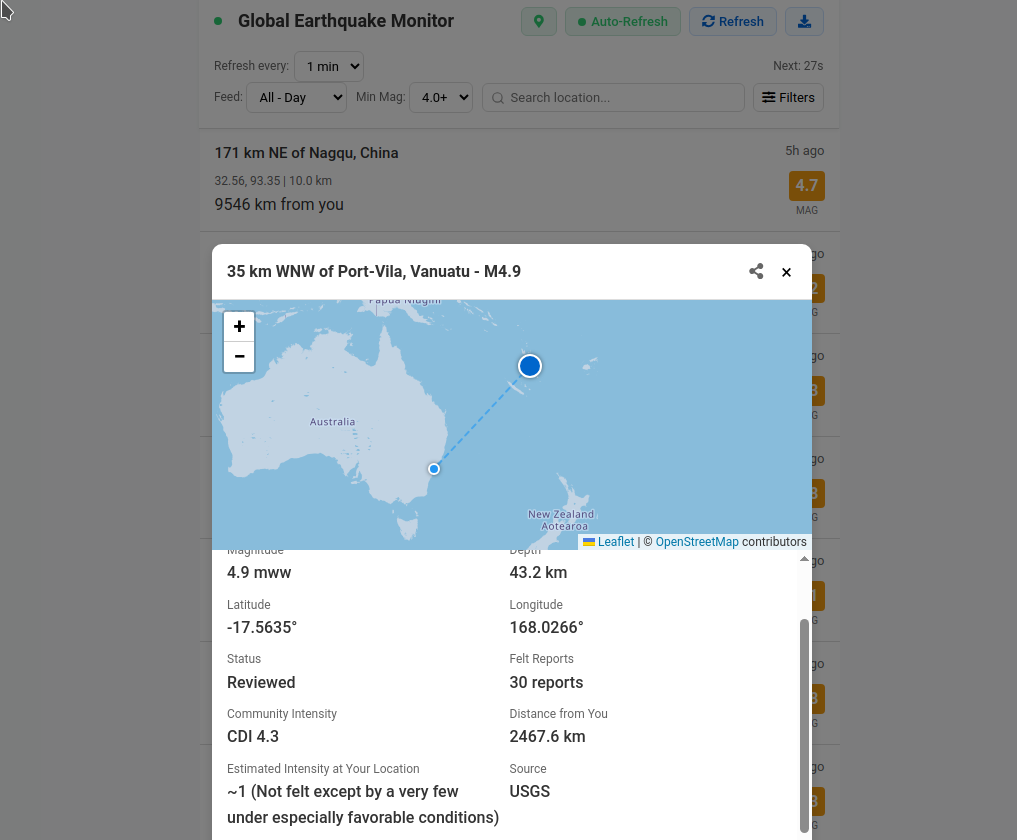
Explore comprehensive earthquake catalogs and analytical tools
Access source code and contribute to the development

As a Seismologist and Systems Support Engineer, I developed these visualization tools to make earthquake data more accessible and understandable. What started as a hobby project has grown into a suite of interactive tools that help researchers, students, and the public explore and analyze seismic data. These platforms utilize real-time data from Bogazici University Kandilli Observatory and Earthquake Research Institute (KOERI) in Turkiye, AFAD in Turkiye, USGS, EMSC-CSEM and Geoscience Australia (GA), presenting it through intuitive interfaces that highlight patterns, trends, and relationships within the data.